Latest Government Study Shows the Outdoor Recreation Economy is Stronger Than Ever
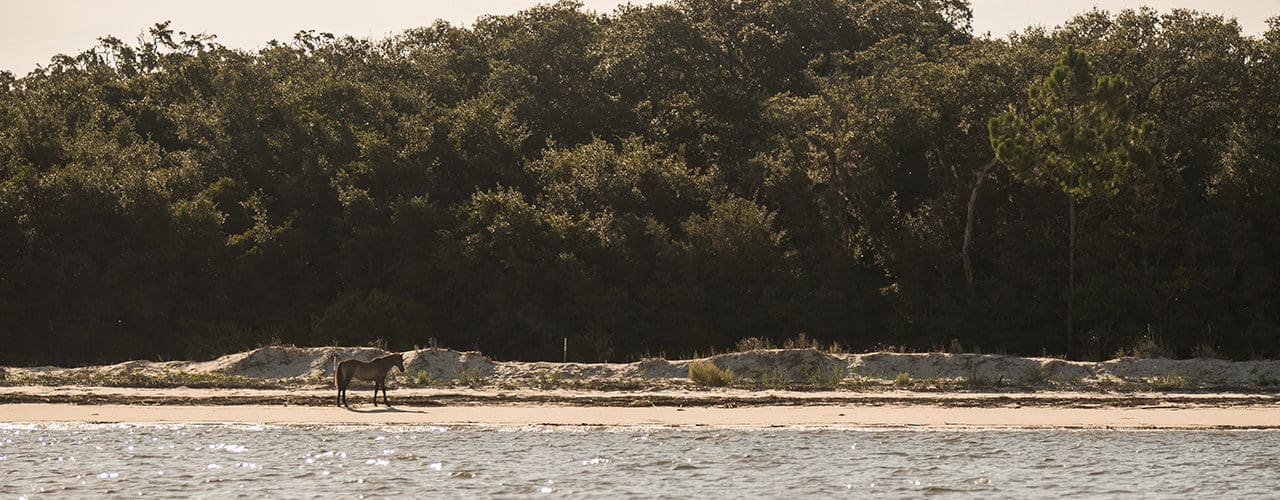
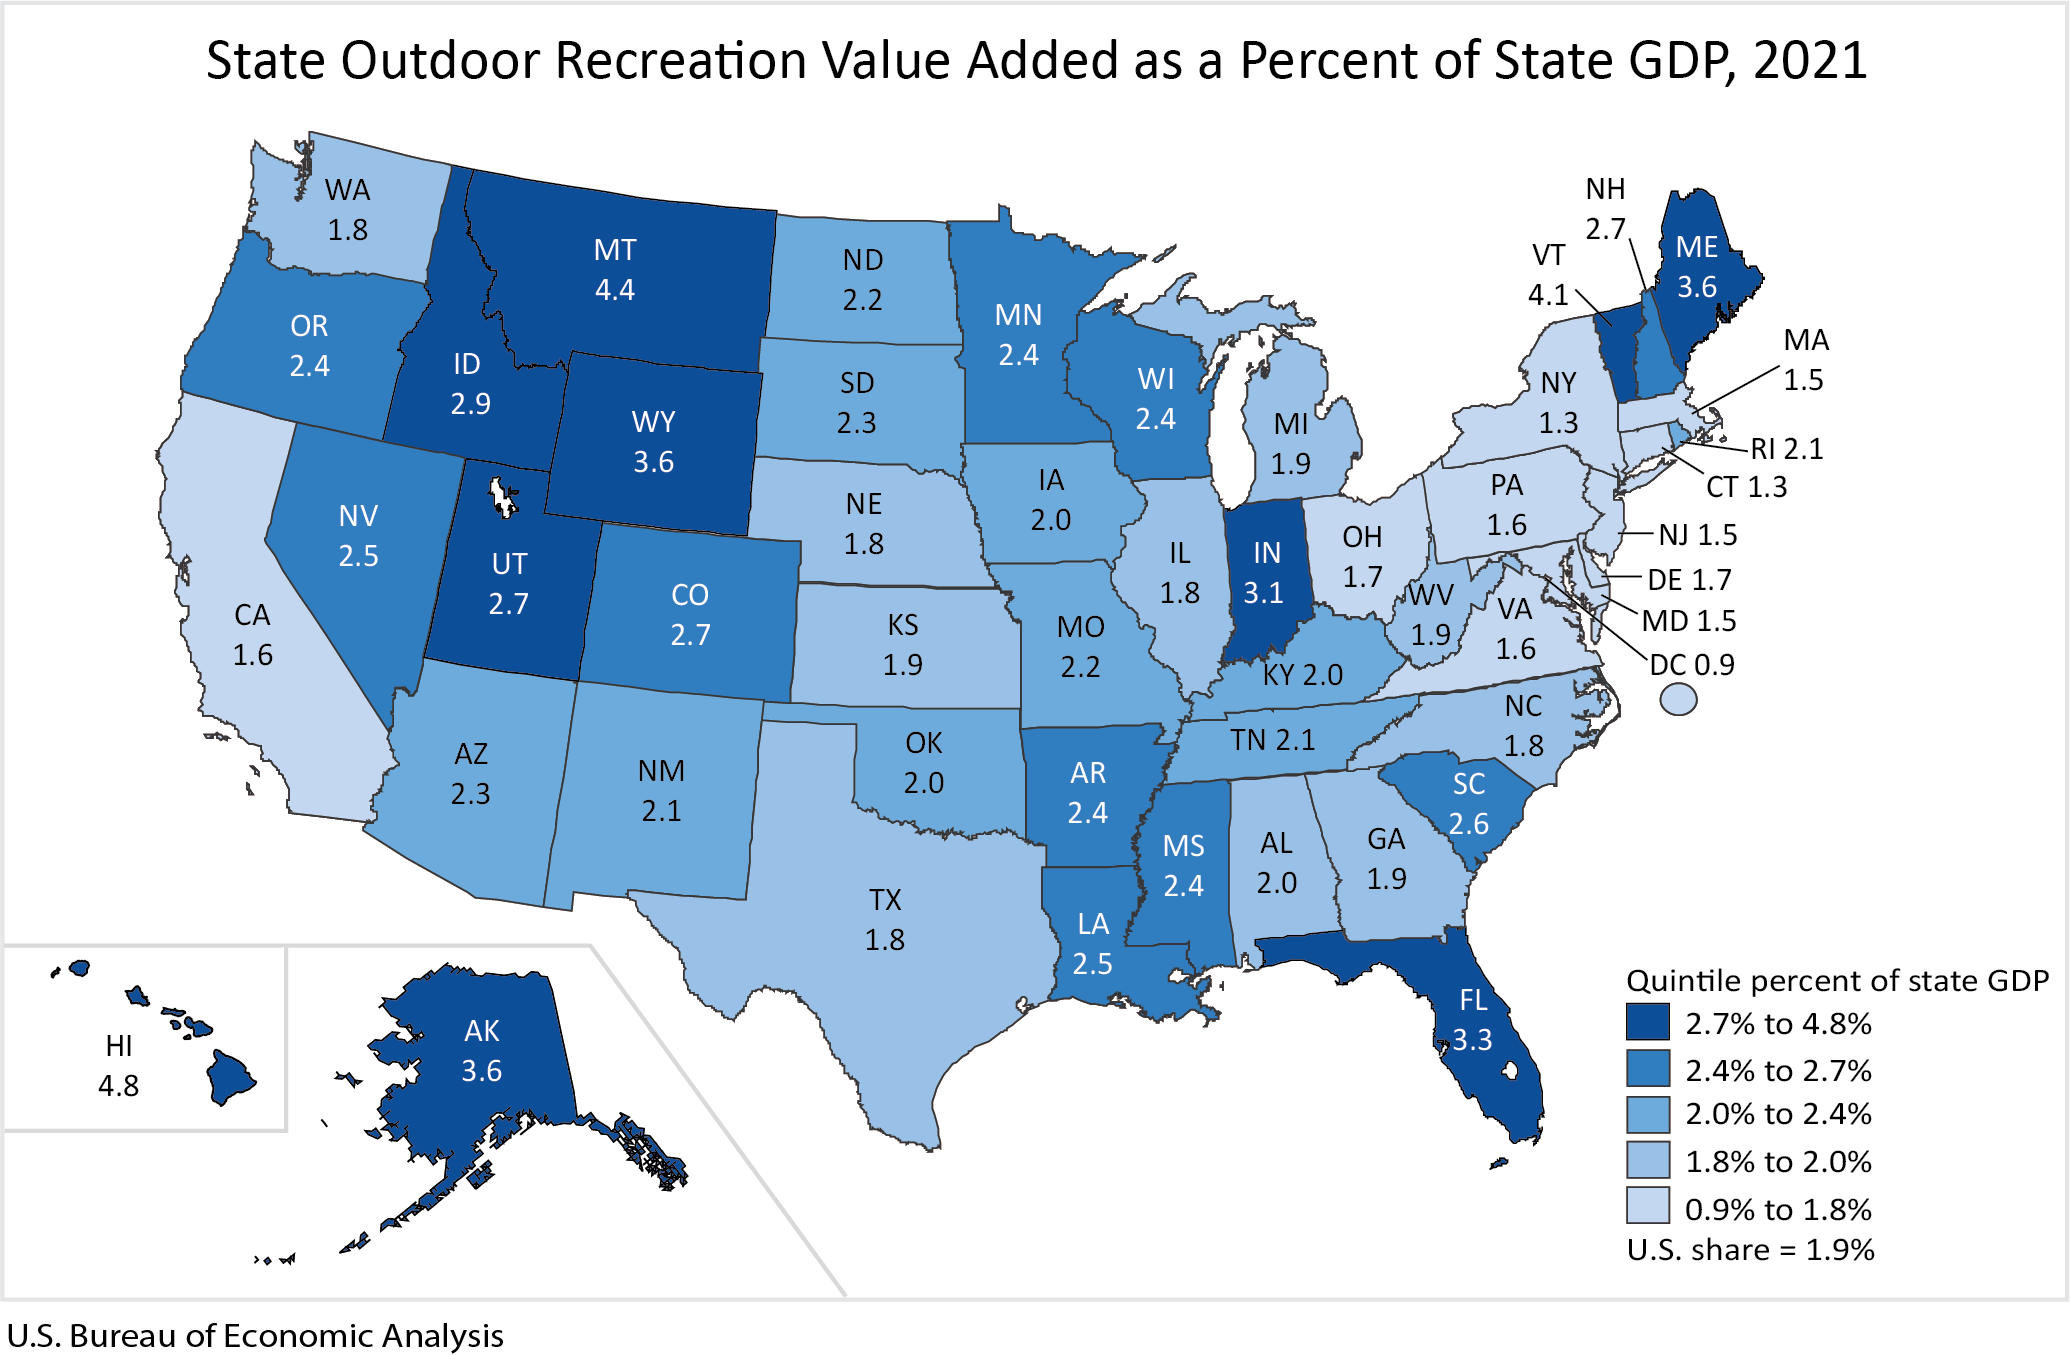
Whether you have witnessed larger populations at local, state and/or national parks over the last few years, experienced longer lines for campsite reservations or have had trouble obtaining a coveted piece of gear hard to obtain due to increased demand, you’re not alone. A report issued earlier this month by the U.S. Bureau of Economic Analysis (BEA) shows that the outdoor recreation economy accounted for 1.9 percent of the GDP (gross domestic product) in 2021. The BEA released its statistics that measure the economy of outdoor recreation across the entire nation, including the District of Columbia. That percentage translates to roughly $862 billion, which is greater than industries like agriculture and mining, and outdoor recreation provides 4.5 million jobs. On a state level, GDP percentages ranged from as low as 0.9 percent in the District of Columbia to 4.8 percent in Hawaii. (see table below for full list)
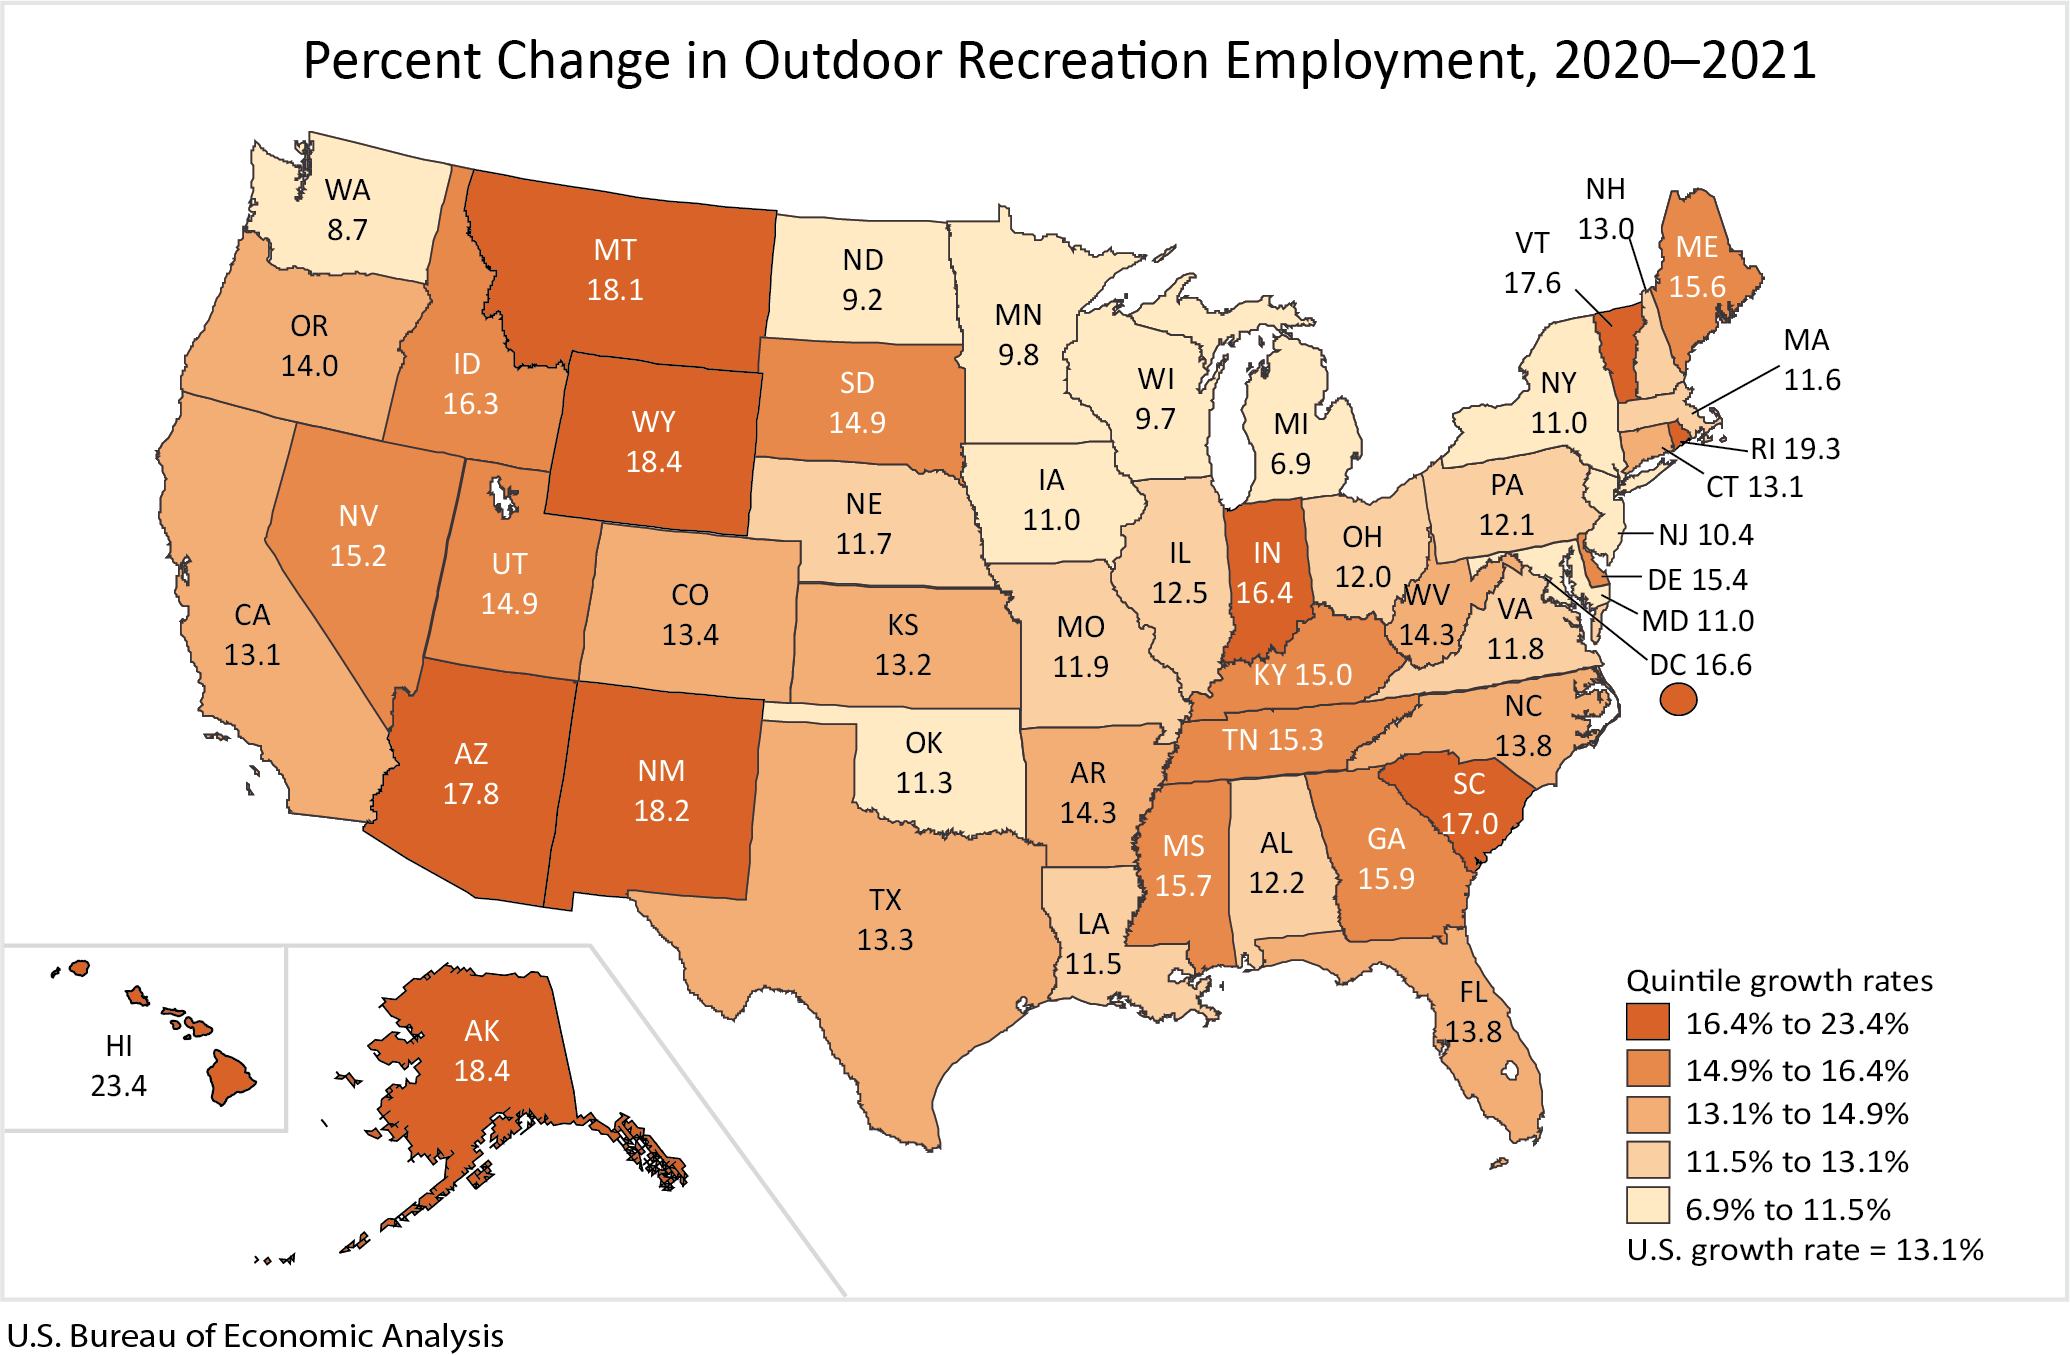
On a state level, employment in the outdoor recreation space increased in 2021. Forty-five states and the District of Columbia all had employment greater than ten percent, with Hawaii topping the list at 23.4 percent.
According to the BEA, outdoor recreation falls into three general categories:
Conventional activities: Cycling, boating, hiking and hunting
Supporting activities: Travel and tourism, construction, etc.
Other: Gardening and outdoor concerts
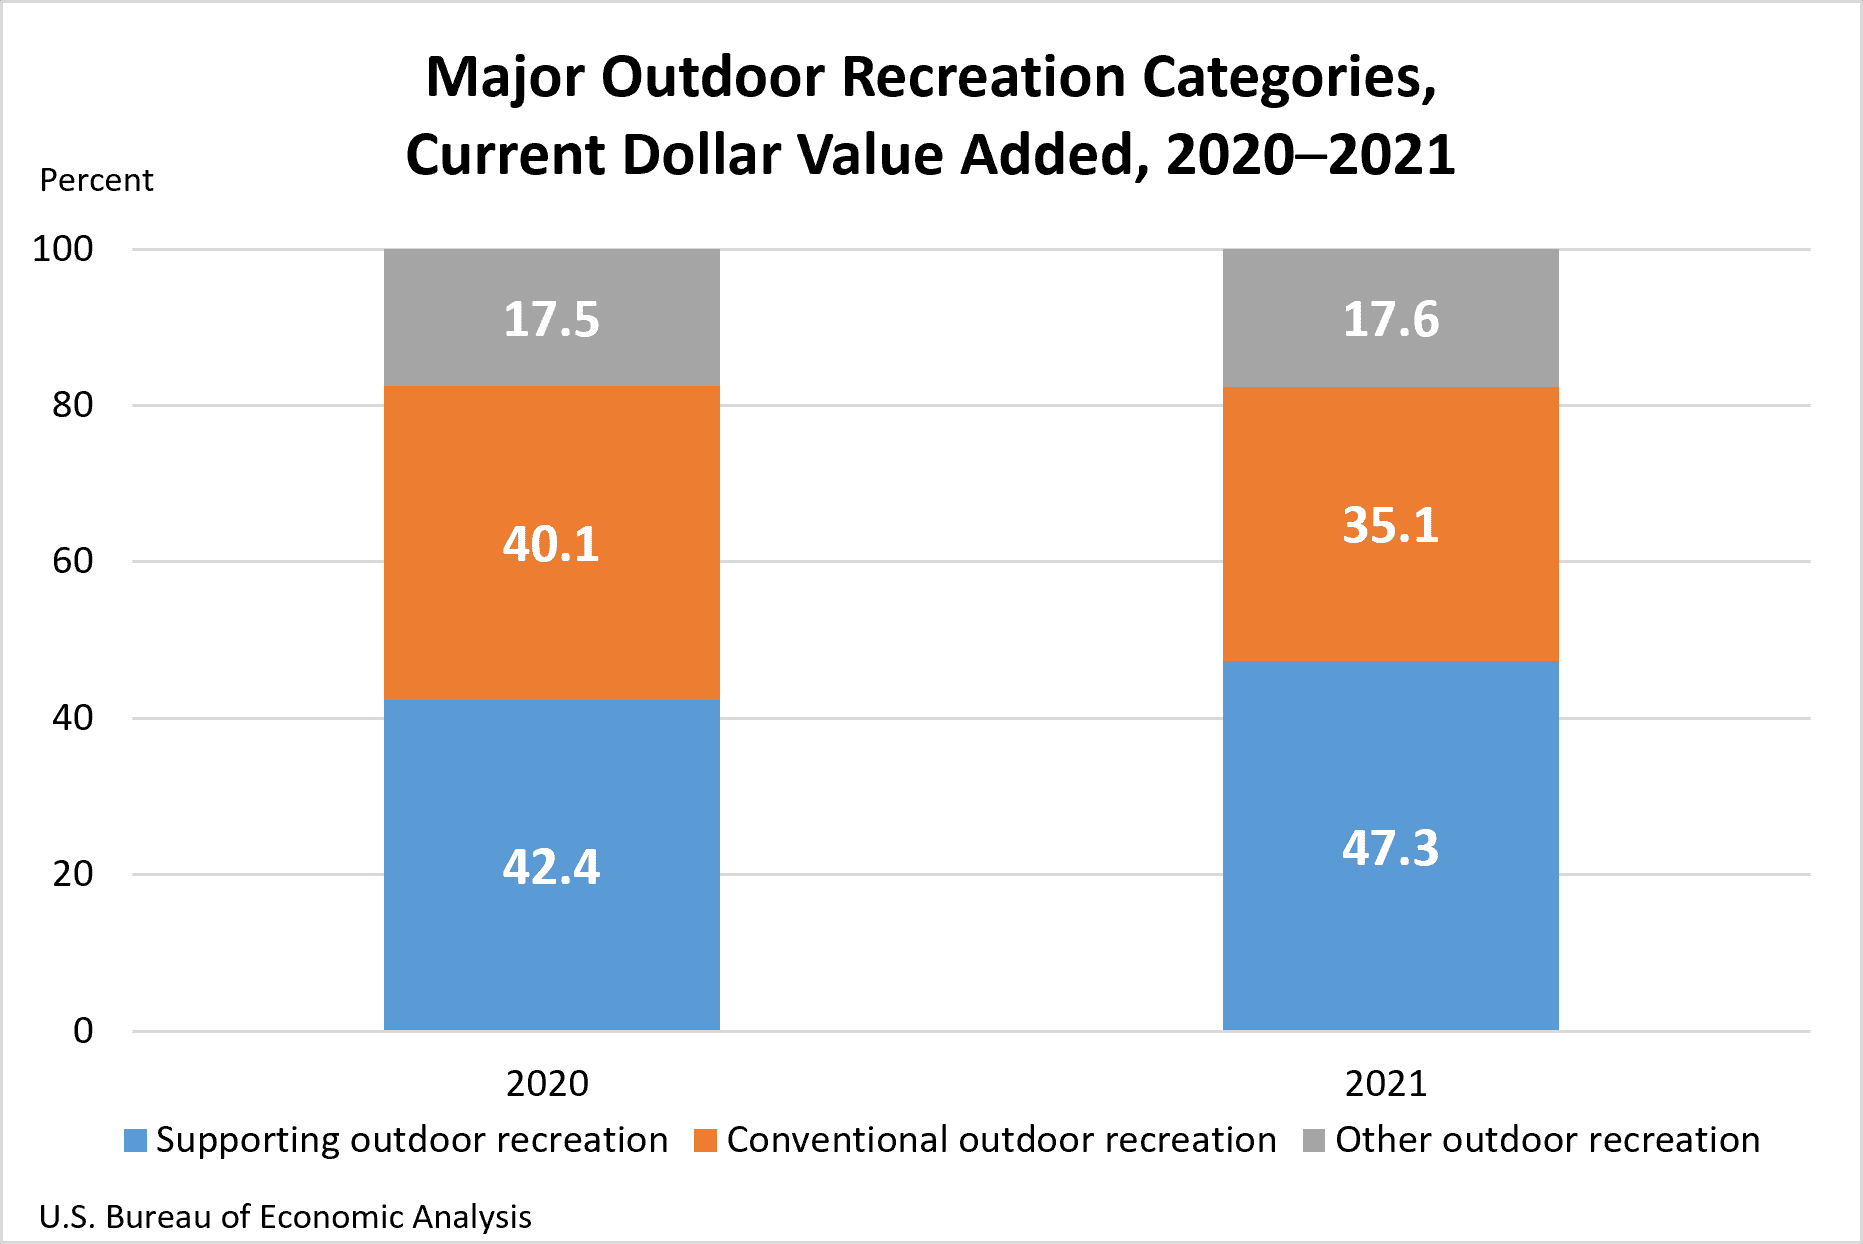
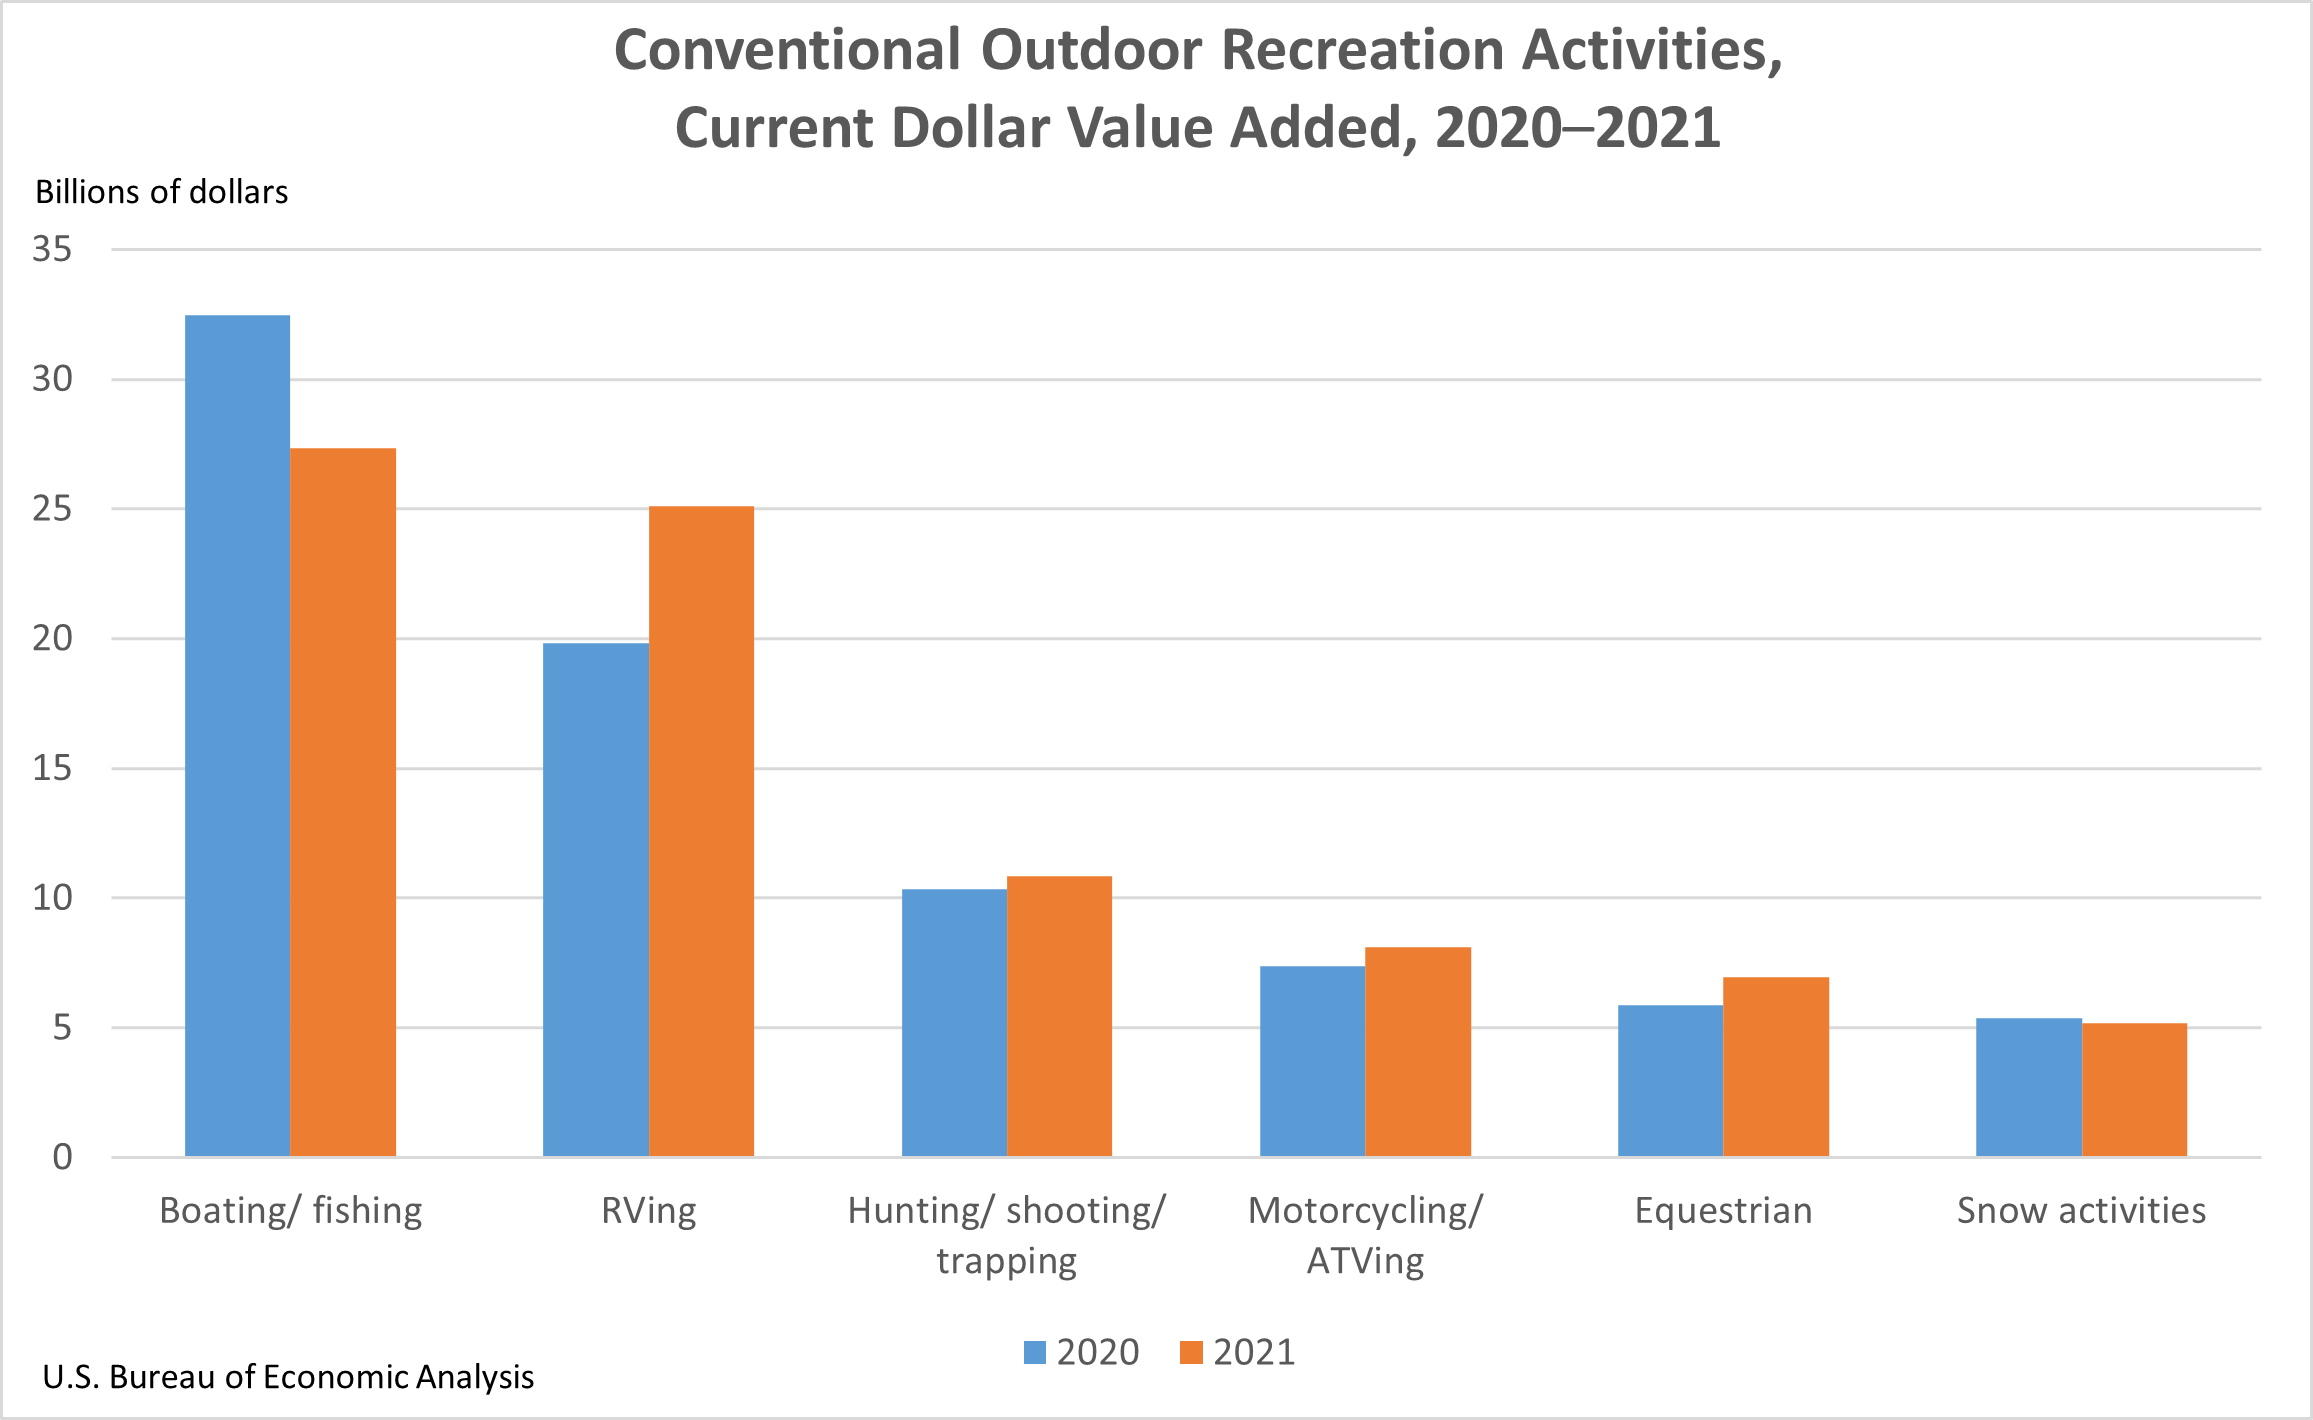
Unlike the high of 40.1 percent in 2020, conventional recreation accounted for 35.1 percent of outdoor recreation in 2021, whereas supporting activities rebounded in 2021 to 47.3 percent from its previous year of 42.4 percent. This was due in large part to the lifting of restrictions brought on by COVID that hampered the travel and tourism industry the previous year. Other outdoor recreation saw the least amount of change with 17.6 percent in 2021 compared to 17.5 percent in 2020.
Breaking it down even further, all of the following categories in conventional recreation saw growth in 2021 over the previous year.
RVing
Hunting, shooting and trapping
Motorcycling and ATVing
Equestrian
And while seeing a drop from 2020, boating and fishing still tops the list of conventional activities in the nation. It is the largest activity in 27 states and the District of Columbia with the top states being Florida, California and Texas.
RVing held onto the number two spot on the list of conventional activities in the nation while also seeing the greatest amount of growth. The top-producing states in this category are Indiana, Texas and California.
According to Winnebago Industries, a leading North American manufacturer of outdoor lifestyle products, 11 million households participate in the RVing lifestyle. Additionally, the company has seen unprecedented growth over the past six years, which has tripled their employment.
In 2021, hunting, shooting and trapping were the largest conventional activity in two states with the largest contributing states being Texas, California and Georgia.
And while snow activities are limited to a shorter season than other conventional activities, it remains the largest conventional activity in four states with the biggest contributors being Colorado (with over $1 billion), Utah and California.
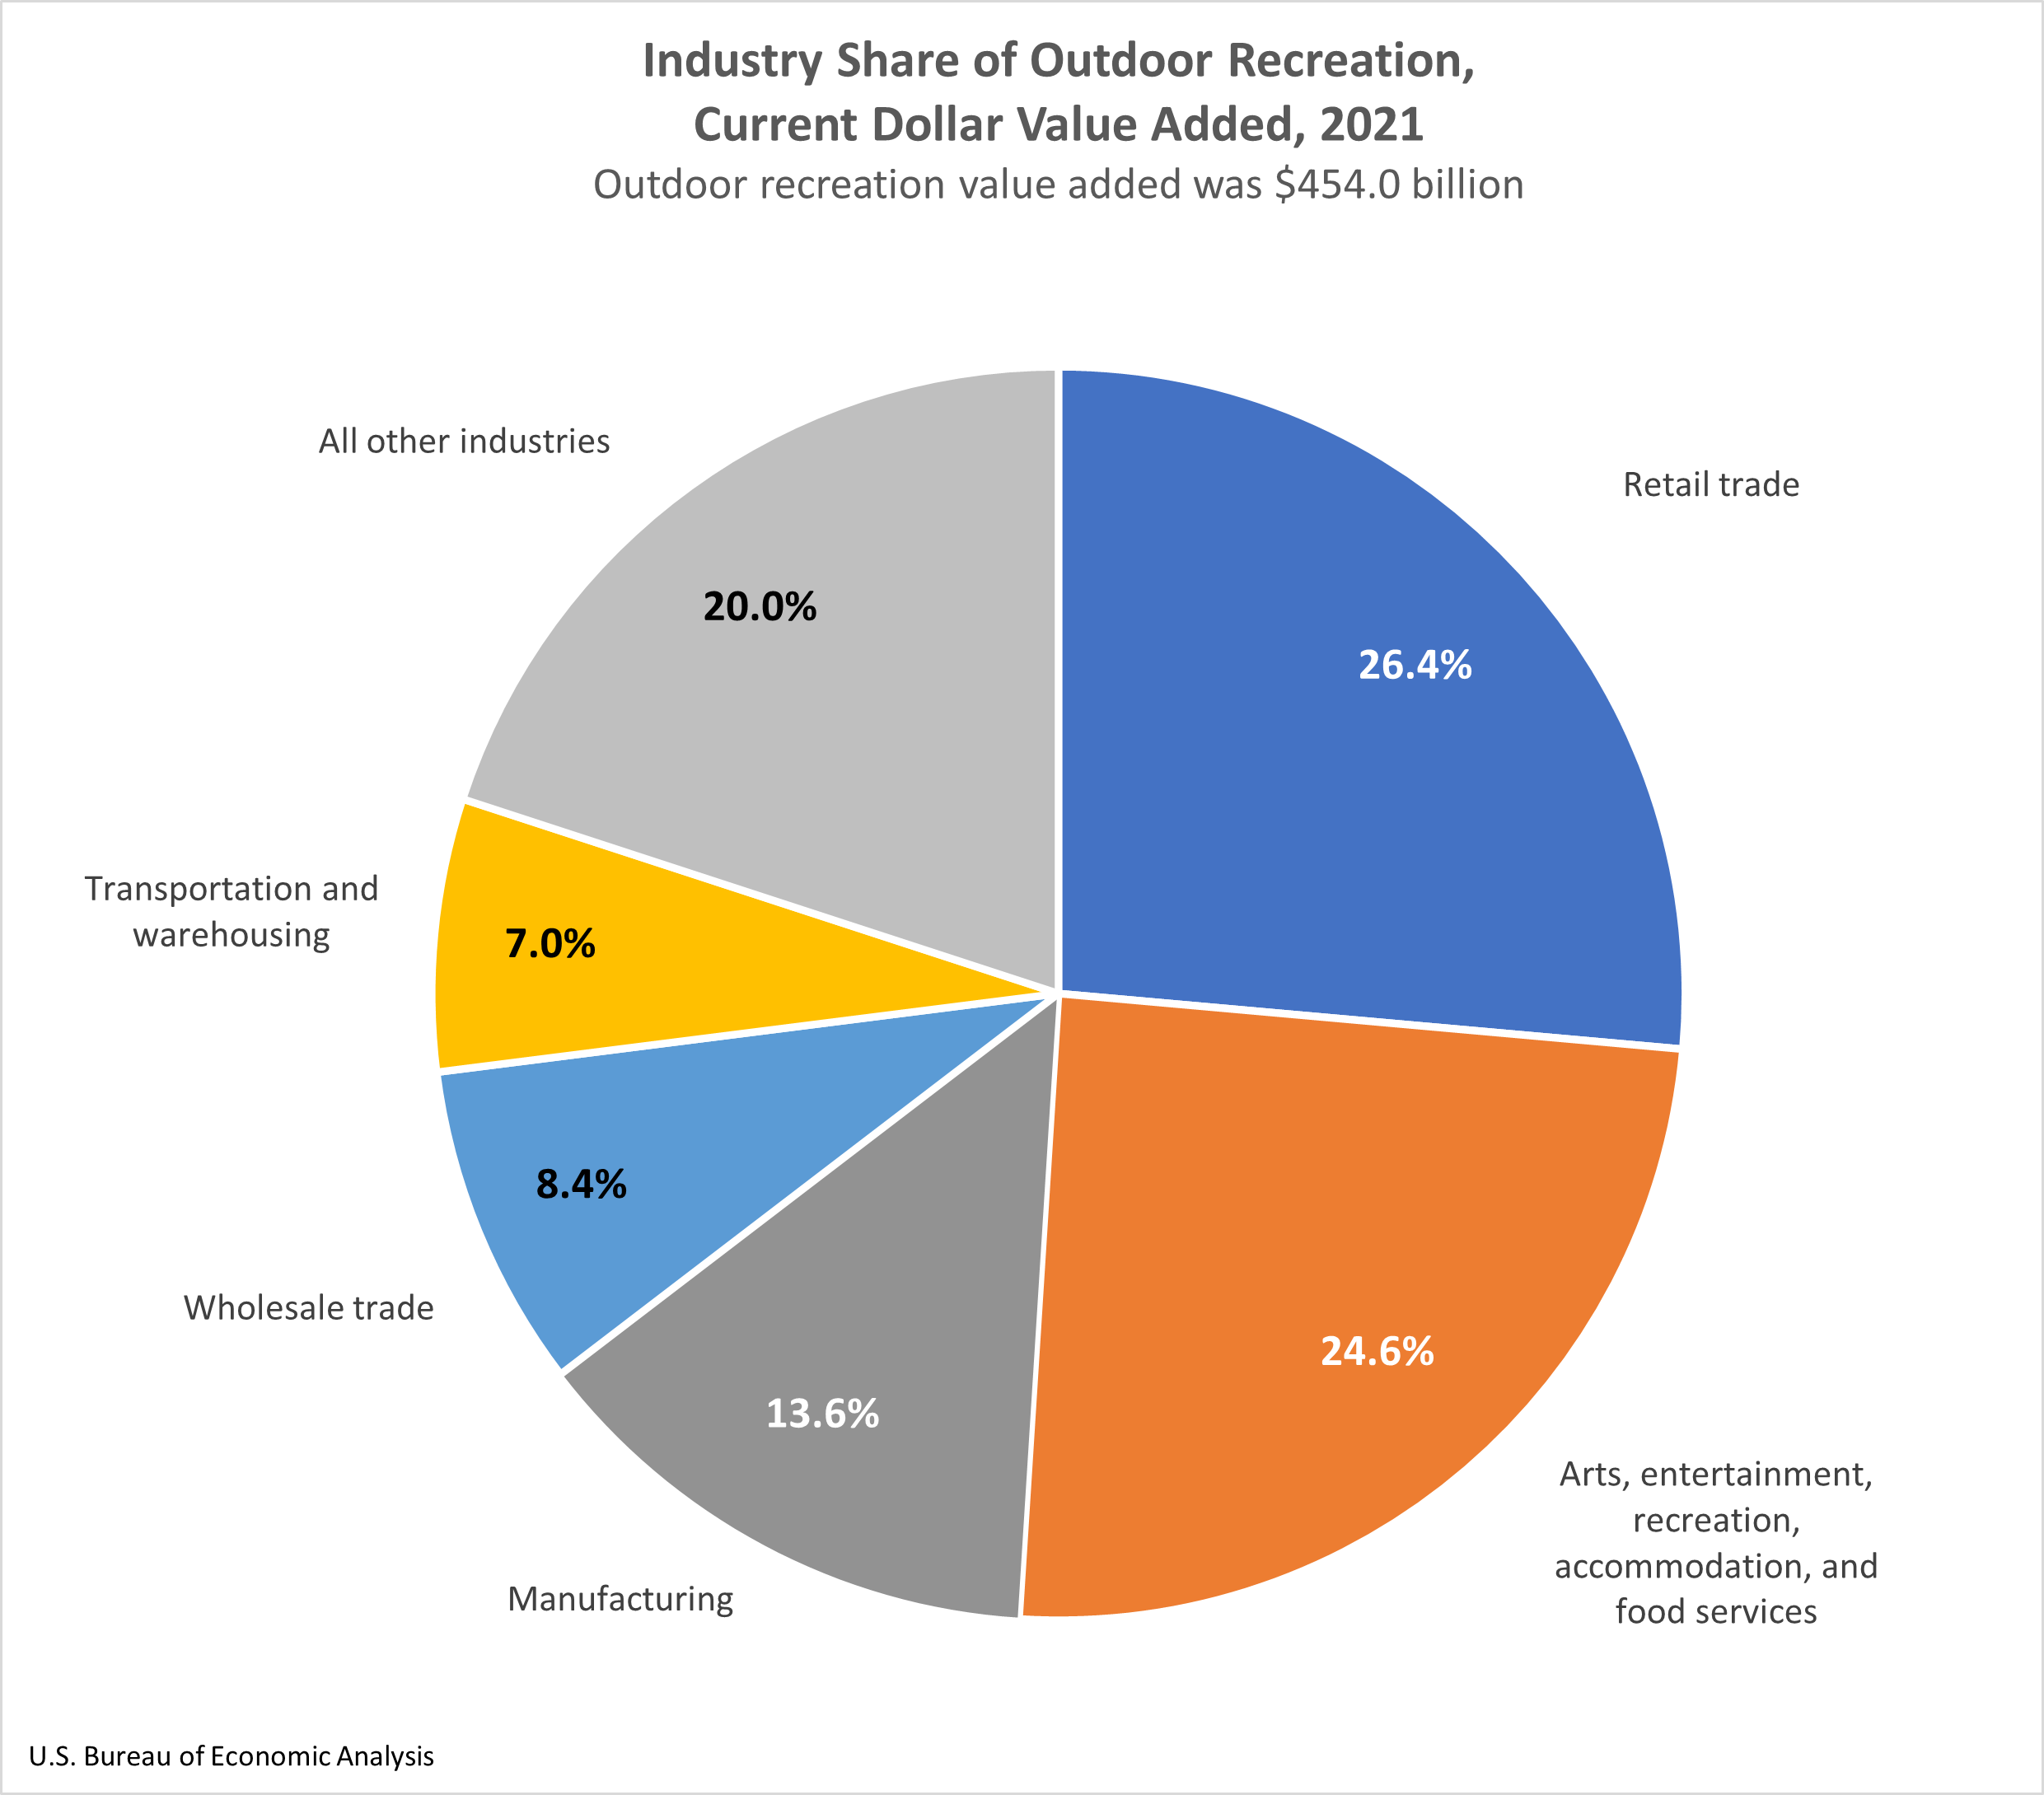
By industry, outdoor recreation can be broken down into the following categories:
Retail trade
Arts, entertainment, recreation, accommodation and food services
Manufacturing
Transportation and warehousing
Wholesale trade
All other industries
Comprising over 26 percent of the outdoor recreation economy, retail trade contributed $119.9 billion and was the largest contributor in 33 states. The largest state contributors were California, Texas and Florida.
And following closely behind at 24.6 percent of the outdoor recreation market was arts, entertainment, recreation, accommodation and food services. This was the largest industry group in 15 states and the District of Columbia with the largest contributors being California, Florida and New York.
The next report will be released in November 2023.
Nearly a trillion dollar industry, outdoor recreation will continue to grow across the spectrum. Whether you’re an emerging or heritage brand, staying on the forefront of evolving markets is essential. As a fully integrated marketing firm, TBA Outdoors can cover these bases — and lots more — for your brand. Reach out to our team of marketing professionals today to see how we can help your outdoor brand with its marketing campaigns and more.