Latest Government Study Shows the Outdoor Recreation Economy Continues to Surge Upward
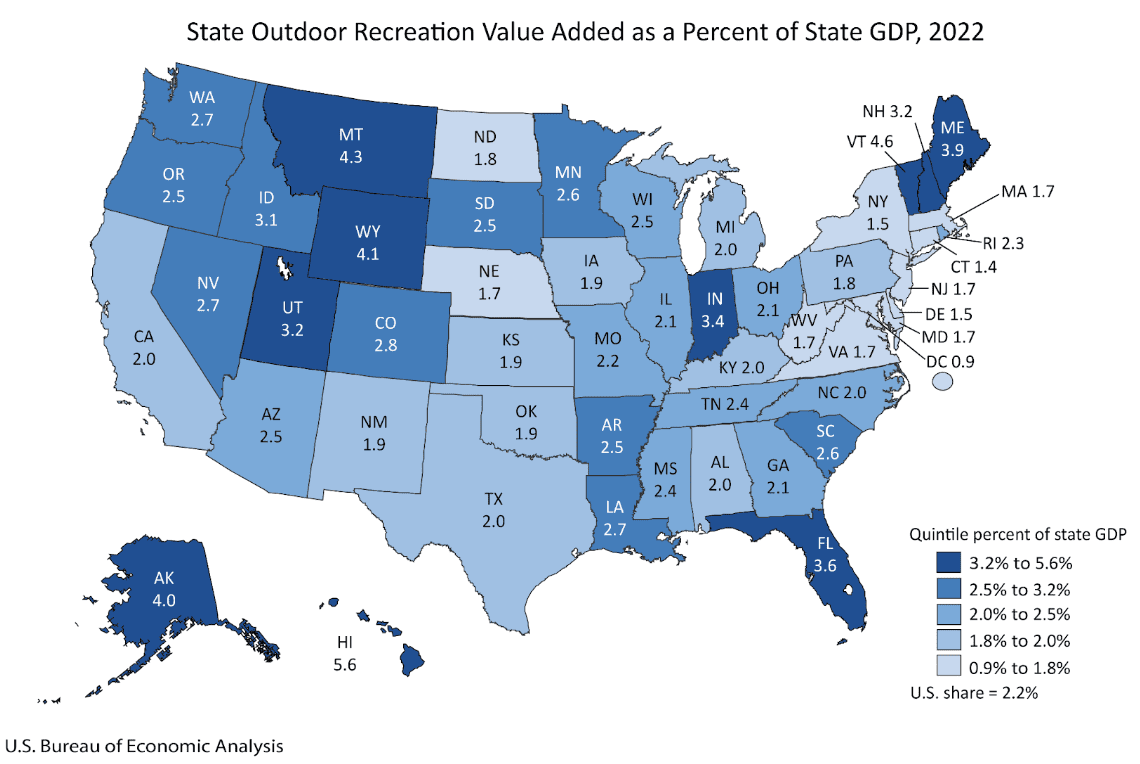
Whether you have witnessed larger populations at local, state and/or national parks over the last few years, experienced longer lines for campsite reservations or have had trouble obtaining a coveted piece of gear hard to obtain due to increased demand, you’re not alone. A report issued last month by the U.S. Bureau of Economic Analysis (BEA) shows that the outdoor recreation economy accounted for 2.2 percent of the GDP (gross domestic product) in 2022 (up from 1.9% in 2021). The BEA released its statistics that measure the economy of outdoor recreation across the entire nation, including the District of Columbia. That percentage translates to roughly $563.7 billion, which is greater than industries like agriculture and mining, and outdoor recreation provides over 4 million jobs. On a state level, GDP percentages ranged from as low as 0.9 percent (same as 2021) in the District of Columbia to 5.6 percent (up from 4.8%) in Hawaii. (see table below for full list)
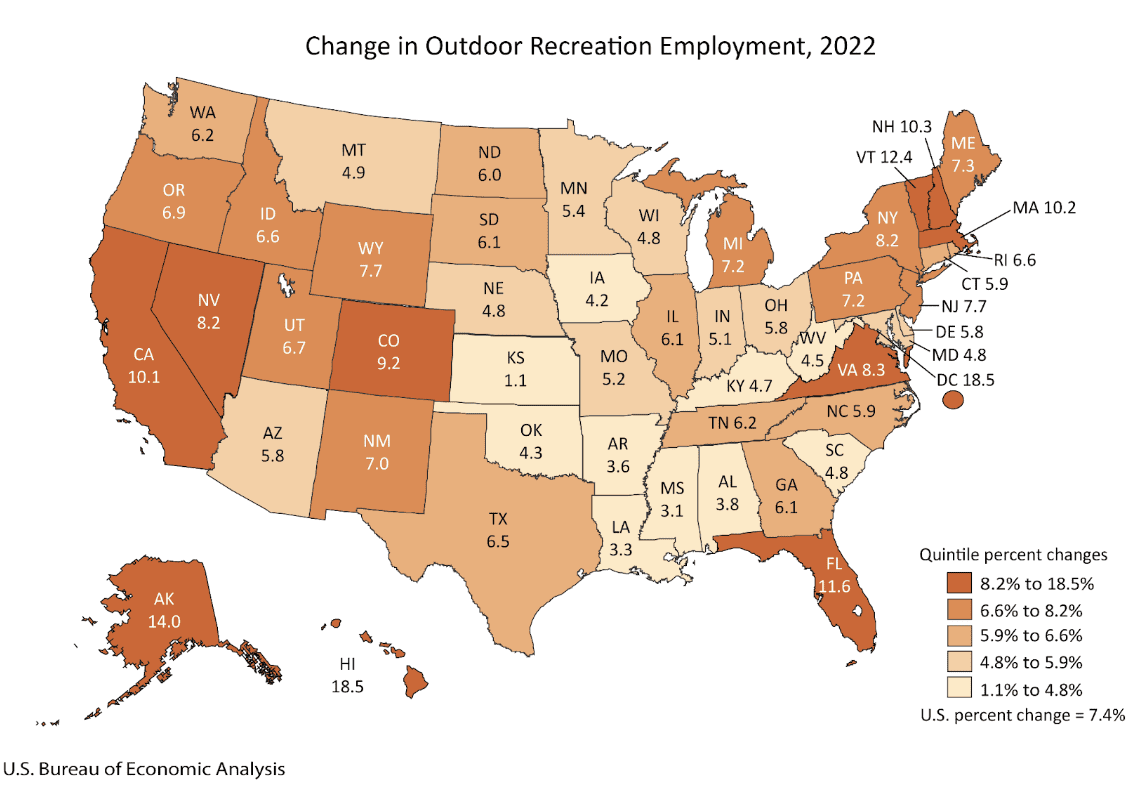
Across all 50 states and the District of Columbia, employment in the outdoor recreation space increased in 2022. This ranged from a high of 18.5 percent in Hawaii to 1.1 percent in Kansas.
According to the BEA, outdoor recreation falls into three general categories:
Conventional activities: bicycling, boating, hiking and hunting
Supporting activities: Travel and tourism, construction, etc. …
Other: Gardening and outdoor concerts
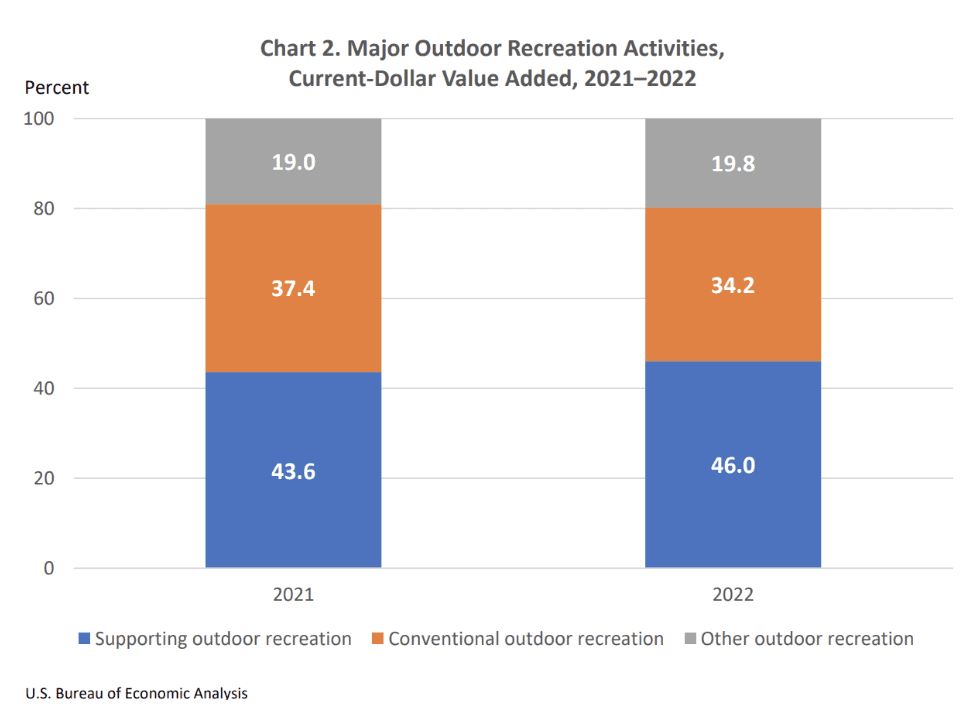
Unlike the high of 40.1 percent in 2020, conventional outdoor recreation accounted for 34.2 percent of outdoor recreation in 2022. Compared with 19 percent in 2021, other outdoor recreation accounted for 19.8 percent in 2022. And supporting activities rounded out the value added with 46 percent, compared with 43.6 percent in 2021.
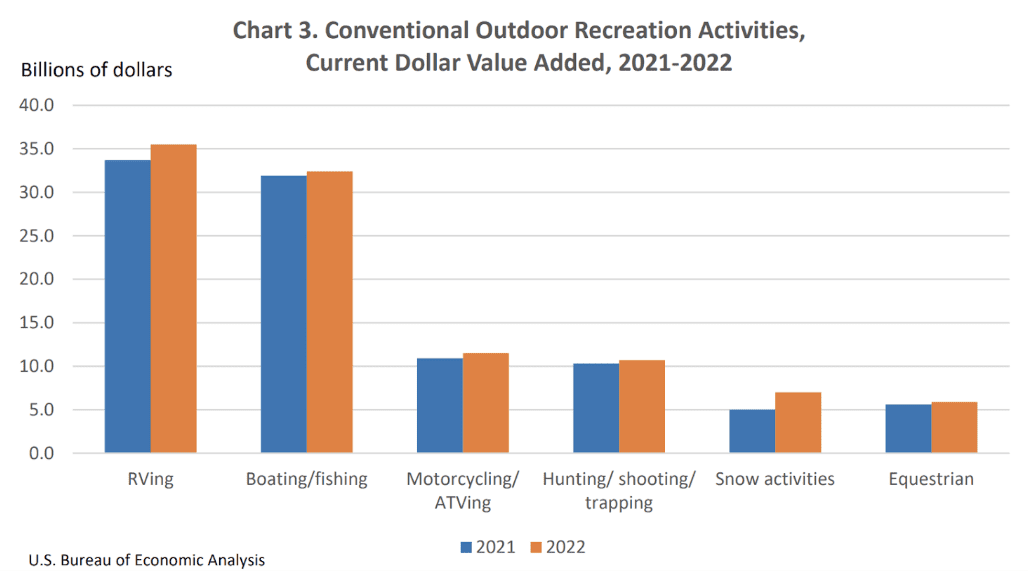
Breaking it down even further, all of the following categories in conventional recreation saw growth in 2022 over the previous year:
RVing was the largest conventional activity for the nation at $35.5 billion in current-dollar value added. It was the largest conventional activity in 22 states with Indiana, Texas and California making the largest contributions.
Boating/fishing was the second-largest conventional activity for the nation at $32.4 billion in current-dollar value added. It was the largest conventional activity in 24 states and the District of Columbia with Florida, California and Texas making the greatest contributions.
Motorcycling/ATVing was the third-largest conventional activity for the nation at $11.5 billion in current-dollar value added. It was the largest conventional activity in Wisconsin. In addition to Wisconsin, the largest contributions were California and Texas.
Snow activity for the nation was $7.0 billion in current-dollar value added and was the largest conventional activity in just three states. The states making the largest contributions were Colorado, California and Utah.
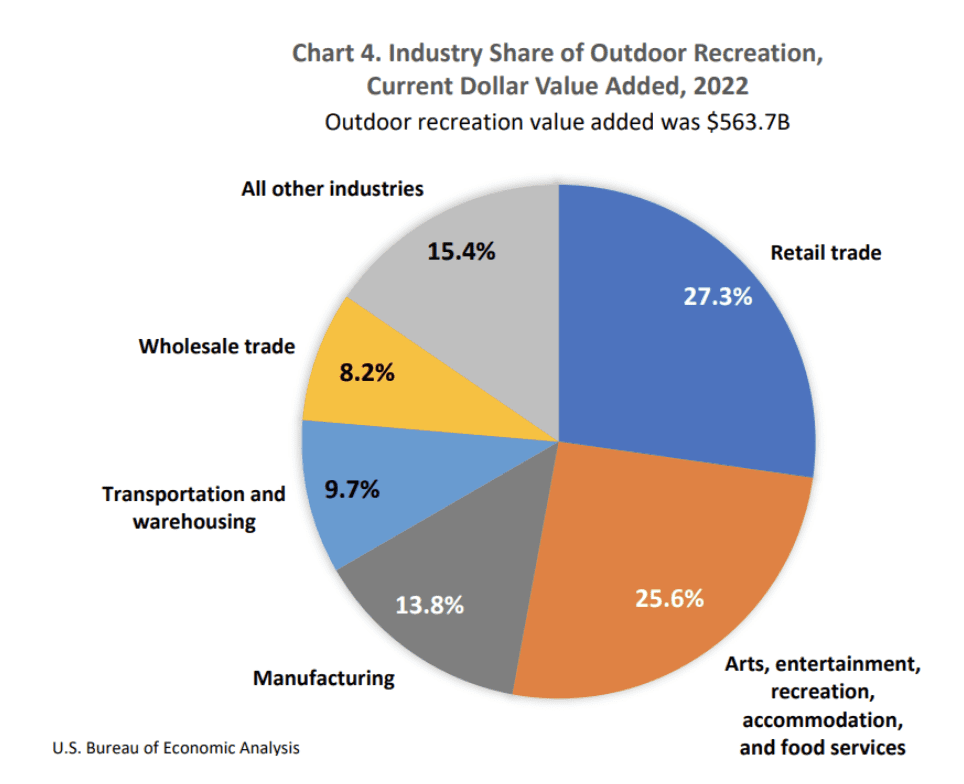
By industry, outdoor recreation can be broken down into the following categories:
Retail trade
Arts, entertainment, recreation, accommodation and food services
Manufacturing
Transportation and warehousing
Wholesale trade
All other industries
Comprising 27.3 percent of the outdoor recreation economy, retail trade contributed $153.6 billion and was the largest contributor in 28 states. The largest state contributors were California, Texas and Florida.
And following closely behind at 25.6 percent ($144.5 billion) of the outdoor recreation market was arts, entertainment, recreation, accommodation and food services. This was the largest industry group in 18 states and the District of Columbia with the largest contributors being California, Florida and New York.
The next report will be released in November 2024.
Trending year over year, outdoor recreation continues to grow across the spectrum. Whether you’re an emerging or heritage brand, staying on the forefront of evolving markets is essential. As a fully integrated marketing firm, TBA Outdoors can cover these bases — and lots more — for your brand. Reach out to our team of marketing professionals today to see how we can help your outdoor brand with its marketing campaigns and more.